Saturday, 18 January 2020
12:19 AM
Diversity matters [Bits of DNA] 12:19 AM, Saturday, 18 January 2020 12:00 AM, Friday, 30 July 2021
The widespread establishment of statistics departments in the United States during the mid-20th century can be traced to a presentation by Harold Hotelling in the Berkeley Symposium on Mathematical Statistics and Probability in 1945. The symposium, organized by Berkeley statistician Jerzy Neyman, was the first of six such symposia that took place every five years, and became the most influential meetings in statistics of their time. Hotelling’s lecture on “The place of statistics in the university” inspired the creation of several statistics departments, and at UC Berkeley, Neyman’s establishment of the statistics department in the 1950s was a landmark moment for statistics in the 20th century.
Neyman was hired in the mathematics department at UC Berkeley by a visionary chair, Griffith Evans, who transformed the UC Berkeley math department into a world-class institution after his hiring in 1934. Evans’ vision for the Berkeley math department included statistics, and Eric Lehmann‘s history of the UC Berkeley statistics department details how Evans’ commitment to diverse areas in the department led him to hire Neyman without even meeting him. However, Evans’ progressive vision for mathematics was not shared by all of his colleagues, and the conservative, parochial attitudes of the math department contributed to Neyman’s breakaway and eventual founding of the statistics department. This dynamic was later repeated at universities across the United States, resulting in a large gulf between mathematicians and statistics (ironically history may be repeating itself with some now suggesting that the emergence of “data science” is a result of conservatism among statisticians leading them to cling to theory rather than to care about data).
The divide between mathematicians and statistics is unfortunate for a number of reasons, one of them being that statistical literacy is important even for the purest of the pure mathematicians. A recent debate on the appropriateness of diversity statements for job applicants in mathematics highlights the need: analysis of data, specifically data on who is in the maths community, and their opinions on the issue, turns out to be central to understanding the matter at hand. Case in point is a recent preprint by two mathematicians:
Joshua Paik and Igor Rivin, Data Analysis of the Responses to Professor Abigail Thompson’s Statement on Mandatory Diversity Statements, arXiv, 2020.
This statistics preprint examines attempts to identify the defining attributes of mathematicians who signed recent letters related to diversity statement requirements in mathematics job searches. I was recently asked to provide feedback on the manuscript, ergo this blog post.
Reproducibility
In order to assess the results of any preprint or paper, it is
essential, as a first step, to be able to reproduce the analysis
and results. In the case of a preprint such as this one, this means
having access to the code and data used to produce the figures and
to perform the calculations. I applaud the authors for being fully
transparent and making available all of their code and data in a
Github repository in a form that made it easy
to reproduce all of their results; indeed I was able to do so
without any problems. 
The dataset
The preprint analyzes data on signatories of three letters submitted in response to an opinion piece on diversity statement requirements for job applicants published by Abigail Thompson, chair of the mathematics department at UC Davis. Thompson’s letter compared diversity statement requirements of job applicants to loyalty oaths required during McCarthyism. The response letters range from strong affirmation of Thompson’s opinions, to strong refutation of them. Signatories of “Letter A”, titled “The math community values a commitment to diversity“, “strongly disagreed with the sentiments and arguments of Dr. Thompson’s editorial” and are critical of the AMS for publishing her editorial.” Signatories of “Letter B”, titled “Letter to the editor“, worry about “direct attempt[s] to destroy Thompson’s career and attempt[s] to intimidate the AMS”. Signatories of “Letter C”, titled “Letter to the Notices of the AMS“, write that they “applaud Abigail Thompson for her courageous leadership [in publishing her editorial]” and “agree wholeheartedly with her sentiments.”
The dataset analyzed by Paik and Rivin combines information scraped from Google Scholar and MathSciNet with data associated to the signatories that was collated by Chad Topaz. The dataset is available in .csv format here.
The Paik and Rivin result
The main result of Paik and Rivin is summarized in the first paragraph of their Conclusion and Discussion section:
“We see the following patterns amongst the “established” mathematicians who signed the three letters: the citations numbers distribution of the signers of Letter A is similar to that of a mid-level mathematics department (such as, say, Temple University), the citations metrics of Letter B are closer to that of a top 20 department such as Rutgers University, while the citations metrics of the signers of Letter C are another tier higher, and are more akin to the distribution of metrics for a truly top department.”
A figure from their preprint summarizing the data supposedly supporting their result, is reproduced below (with the dotted blue line shifted slightly to the right after the bug fix):

Paik and Rivin go a step further, using citation counts and h-indices as proxies for “merit in the judgement of the community.” That is to say, Paik and Rivin claim that mathematicians who signed letter A, i.e. those who strongly disagreed with Thompson’s equivalence between diversity statements and McCarthy’s loyalty oaths, have less “merit in the judgement of the community” than mathematicians who signed letter C, i.e. those who agreed wholeheartedly with her sentiments.
The differential is indeed very large. Paik and Rivin find that the mean number of citations for signers of Letter A is 2397.75, the mean number of citations for signers of Letter B is 4434.89, and the mean number of citations for signers of Letter C is 6226.816. To control for an association between seniority and number of citations, the computed averages are based only on citation counts of full professors. [Note: a bug in the Paik-Rivin code results in an error in their reporting for the mean for group B. They report 4136.432 whereas the number is actually 4434.89.]
This data seems to support Paik and Rivin’s thesis that mathematicians who support the use of diversty statements in hiring and who strongly disagree with Thompson’s analogy of such statements to McCarthy’s loyalty oaths, are second rate mathematicians, whereas those who agree wholeheartedly with Thompson are on par with professors at “truly top departments”.
But do the data really support this conclusion?
A fool’s errand
Before delving into the details of the data Paik and Rivin
analyzed, it is worthwhile to pause and consider the validity of
using citations counts and h-indices as proxies for “merit in
the judgement of the community”. The authors themselves note
that “citations and h-indices do not impose a total order on
the quality of a mathematician” and emphasize that “it
is quite obvious that, unlike in competitive swimming, imposing
such an order is a fool’s errand.” Yet they proceed to
discount their own advice, and wholeheartedly embark on the
fool’s errand they warn against. 
I examined the mathematicians in their dataset and first, as a
sanity check, confirmed that I am one of them (I signed one of the
letters). I then looked at the associated citation counts and
noticed that out of 1435 mathematicians who signed the letters, I
had the second highest number of citations according to Google
Scholar (67,694), second only to Terence Tao (71,530). We are in
the 99.9th percentile. Moreover, I have 27 times more citations than
Igor Rivin. According to Paik and Rivin this implies that I have 27
times more merit in the judgement of our peers. I should say at
least 27 times, because one might imagine that the judgement
of the community is non-linear in the number of citations. Even if
one discounts such quantitative comparisons (Paik and Rivin do note
that Stephen Smale has fewer citations than Terence Tao, and that
it would be difficult on that basis alone to conclude that Tao is
the better mathematician), the preprint makes use of citation
counts to assess “merit in the judgement of the
community”, and thus according to Paik and Rivin my opinions
have substantial merit. In fact, according to them, my opinion on
diversity statements must be an extremely meritorious one. I
imagine they would posit that my opinion on the debate that
is raging in the math community regarding diversity statement
requirements from job applicants is the correct, and definitive
one. Now I can already foresee protestations that, for
example, my article on “Transcript assembly and quantification by RNA-Seq reveals
unannotated transcripts and isoform switching during cell
differentiation” which has 9,438 citations is not math
per se, and that it shouldn’t count. I’ll note that my
biology colleagues, after reading the supplement, think it’s
a math paper, but in any case, if we are going to head down that
route shouldn’t Paik and Rivin read the paper to be sure? And
shouldn’t they read every paper of mine, and every paper of
every signatory to determine it is valid for their analysis? And
shouldn’t they adjust the citation counts of every signatory?
Well they didn’t do any of that, and besides, they included
me in their analysis so… I proceed…
The citation numbers above are based on Google Scholar citations. Paik and Rivin also analyze MathSciNet citations and state that they prefer them because “only published mathematics are in MathSciNet, and is hence a higher quality data source when comparing mathematicians.” I checked the relationship between Scholar and MathSciNet citations and found that, not surprisingly, they have a correlation of 0.92:

I’d say they are therefore interchangeable in terms of the authors’ use of them as a proxy for “merit”.
But citations are not proxies for merit. The entire premise of the preprint is ridiculous. Furthermore, even if it was true that citations were a meaningful attribute of the signatories to analyze, there are many other serious problems with the preprint.
The elephant not in the room
Paik and Rivin begin their preprint with a cursory examination of the data and immediately identify a potential problem… missing data. How much data is missing? 64.11% of individuals do not have associated Google Scholar citation data, and 78.82% don’t have MathSciNet citation data. Paik and Rivin brush this issue aside remarking that “while this is not optimal, a quick sample size calculation shows that one needs 303 samples or 21% of the data to produce statistics at a 95% confidence level and a 5% confidence interval.” They are apparently unaware of the need for uniform population sampling, and don’t appear to even think for a second of the possible ascertainment biases in their data. I thought for a second.
For instance, I wondered whether there might be a discrepancy between the number of citations of women with Google Scholar pages vs. women without such pages. This is because I’ve noticed anecdotally that several senior women mathematicians I know don’t have Google Scholar pages, and since senior scientists presumably have more citations this could create a problematic ascertainment bias. I checked and there is, as expected, some correlation between age post-Ph.D. and citation count (cor = 0.36):

To test whether there is an association between presence of a Google Scholar page and citation number I examined the average number of MathSciNet citations of women with and without Google Scholar pages. Indeed, the average number of citations of women without Google Scholar pages is much lower than those with a Google Scholar page (898 vs. 621). For men the difference is much smaller (1816 vs. 1801). By the way, the difference in citation number between men and women is itself large, and can be explained by a number of differences starting with the fact that the women represented in the database have much lower age post-Ph.D. than the men (17.6 vs. 26.3), and therefore fewer citations (see correlation between age and citations above).
The analysis above suggests that perhaps one should use MathSciNet citation counts instead of Google Scholar. However the extent of missing data for that attribute is highly problematic (78.82% missing values). For one thing, my own MathSciNet citation counts are missing, so there were probably bugs in the scraping. The numbers are also tiny. There are only 46 women with MathSciNet data among all three letter signatories out of 452 women signatories. I believe the data is unreliable. In fact, even my ascertainment bias analysis above is problematic due to the small number of individuals involved. It would be completely appropriate at this point to accept that the data is not of sufficient quality for even rudimentary analysis. Yet the authors continued.
A big word
Confounder is a big word for a variable that influences both the dependent and independent variable in an analysis, thus causing a spurious association. The word does not appear in Paik and Rivin’s manuscript, which is unfortunate because it is in fact a confounder that explains their main “result”. This confounder is age. I’ve already shown the strong relationship between age post-Ph.D. and citation count in a figure above. Paik and Rivin examine the age distribution of the different letter signatories and find distinct differences. The figure below is reproduced from their preprint:
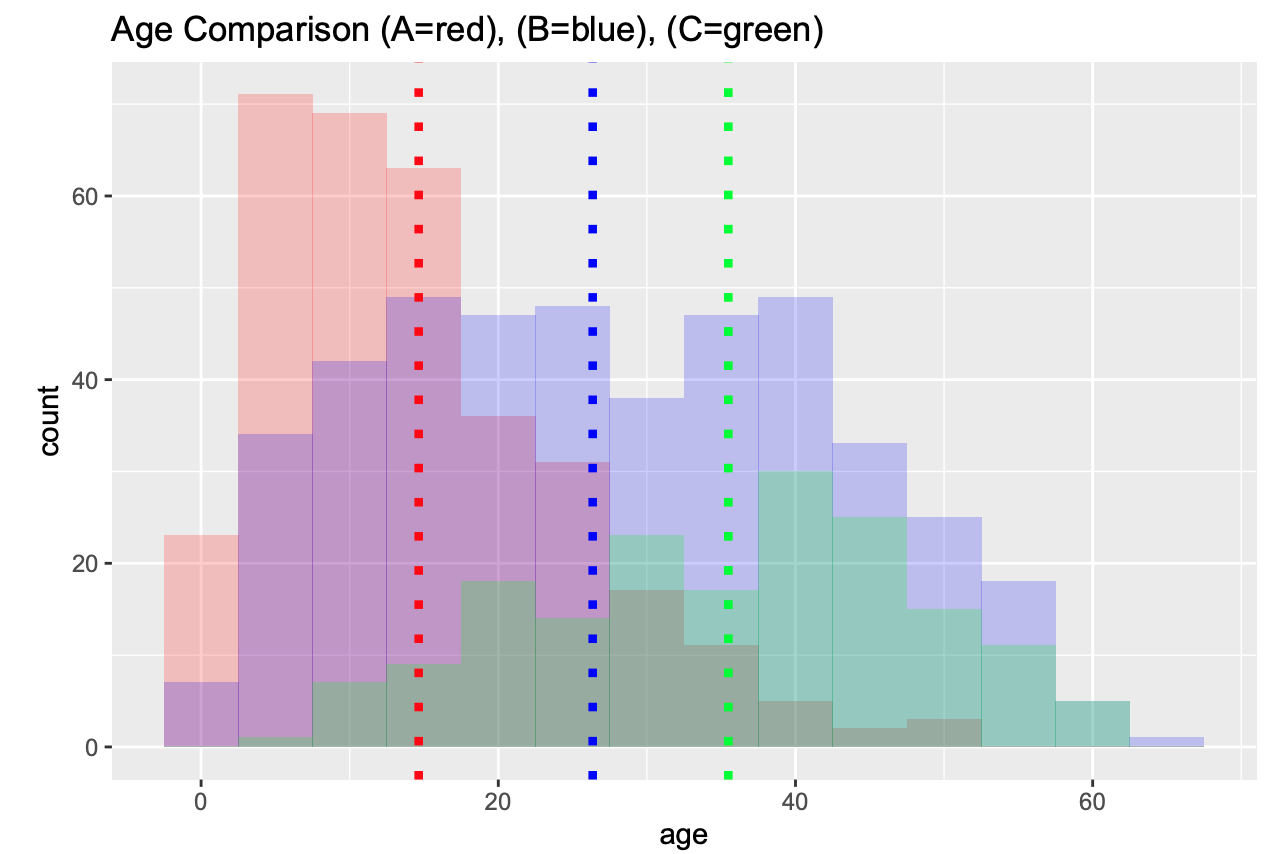
The differences are stark: the mean time since PhD completion of signers of Letter A is 14.64 years, the mean time since PhD completion of signers of Letter B is 27.76 years and the the mean time since PhD completion of signers of Letter C is 35.48 years. Presumably to control for this association, Paik and Rivin restricted the citation count computations to full professors. As it turns out, this restriction alone does not control for age.
The figure below shows the number of citations of letter C signatories who are full professors as a function of their age:

The red line at 36 years post-Ph.D. divides two distinct regimes. The large jump at that time (corresponding to chronological age ~60) is not surprising: senior professors in mathematics are more famous and have more influence than their junior peers, and their work has had more time to be understood and appreciated. In mathematics results can take many years before they are understood and integrated into mainstream mathematics. These are just hypotheses, but the exact reason for this effect is not important for the Paik-Rivin analysis. What matters is that there are almost no full professors among Letter A signers who are more than 36 years post-Ph.D. In fact, the number of such individuals (filtered for those who have published at least 1 article), is 2. Two individuals. That’s it.
Restricting the analysis to full professors less than 36 years post-Ph.D. tells a completely different story to the one Paik and Rivin peddle. The average number of citations of full professors who signed letter A (2922.72) is higher than the average number of citations of full professors who signed letter C (2348.85). Signers of letter B have 3148.83 citations on average. The figure for this analysis is shown below:

The main conclusion of Paik and Rivin, that signers of letters A have less merit than signers of letter B, who in turn have less merit than signers of letter C can be seen to be complete rubbish. What the data reveal is simply that the signers of letter A are younger than the signers of the other two letters.
Note: I have performed my analysis in a Google Colab notebook accessible via the link. It allows for full reproducibility of the figures and numbers in this post, and facilitates easy exploration of the data. Of course there’s nothing to explore. Use of citations as a proxy for merit is a fool’s errand.
Miscellania
There are numerous other technical problems with the preprint. The authors claim to have performed “a control” (they didn’t). Several p-values are computed and reported without any multiple testing correction. Parametric approximations for the citation data are examined, but then ignored. Moreover, appropriate zero-inflated count distributions for such data are never considered (see e.g. Yong-Gil et al. 2007). The results presented are all univariate (e.g. histograms of one data type)- there is not a single scatterplot in the preprint! This suggests that the authors are unaware of the field of multivariate statistics. Considering all of this, I encourage the authors to enroll in an introductory statistics class.
The Russians
In a strange final paragraph of the Conclusion and Discussion section of their preprint, Paik and Rivin speculate on why mathematicians from communist countries are not represented among the signers of letter A. They present hypotheses without any data to back up their claims.
The insistence that some mathematicians, e.g. Mikhail Gromov who signed letters B and C and is a full member at IHES and professor at NYU, are not part of the “power elite” of mathematics is just ridiculous. Furthermore, characterizing someone like Gromov, who arrived in the US from Russia to an arranged job at SUNY Stonybrook (thanks to Tony Phillips) as being a member of a group who “arrived at the US with nothing but the shirts on their backs” is bizarre.
Diversity matters
I find the current debate in the mathematics community surrounding Prof. Thompson’s letter very frustrating. The comparison of diversity statements to McCarthy’s loyalty oaths is ridiculous. Instead of debating such nonsense, mathematicians need to think long and hard about how to change the culture in their departments, a culture that has led to appallingly few under-represented minorities and women in the field. Under-represented minorities and women routinely face discrimination and worse. This is completely unacceptable.
The preprint by Paik and Rivin is a cynical attempt to use the Thompson kerfuffle to advertise the tired trope of the second-rate mathematician being the one to advocate for greater diversity in mathematics. It’s a sad refrain that has a long history in mathematics. But perhaps it’s not surprising. The colleagues of Jerzy Neyman in his mathematics department could not even stomach a statistician, let alone a woman, let alone a person from an under-represented minority group. However I’m optimistic reading the list of signatories of letter A. Many of my mathematical heroes are among them. The future is theirs, and they are right.